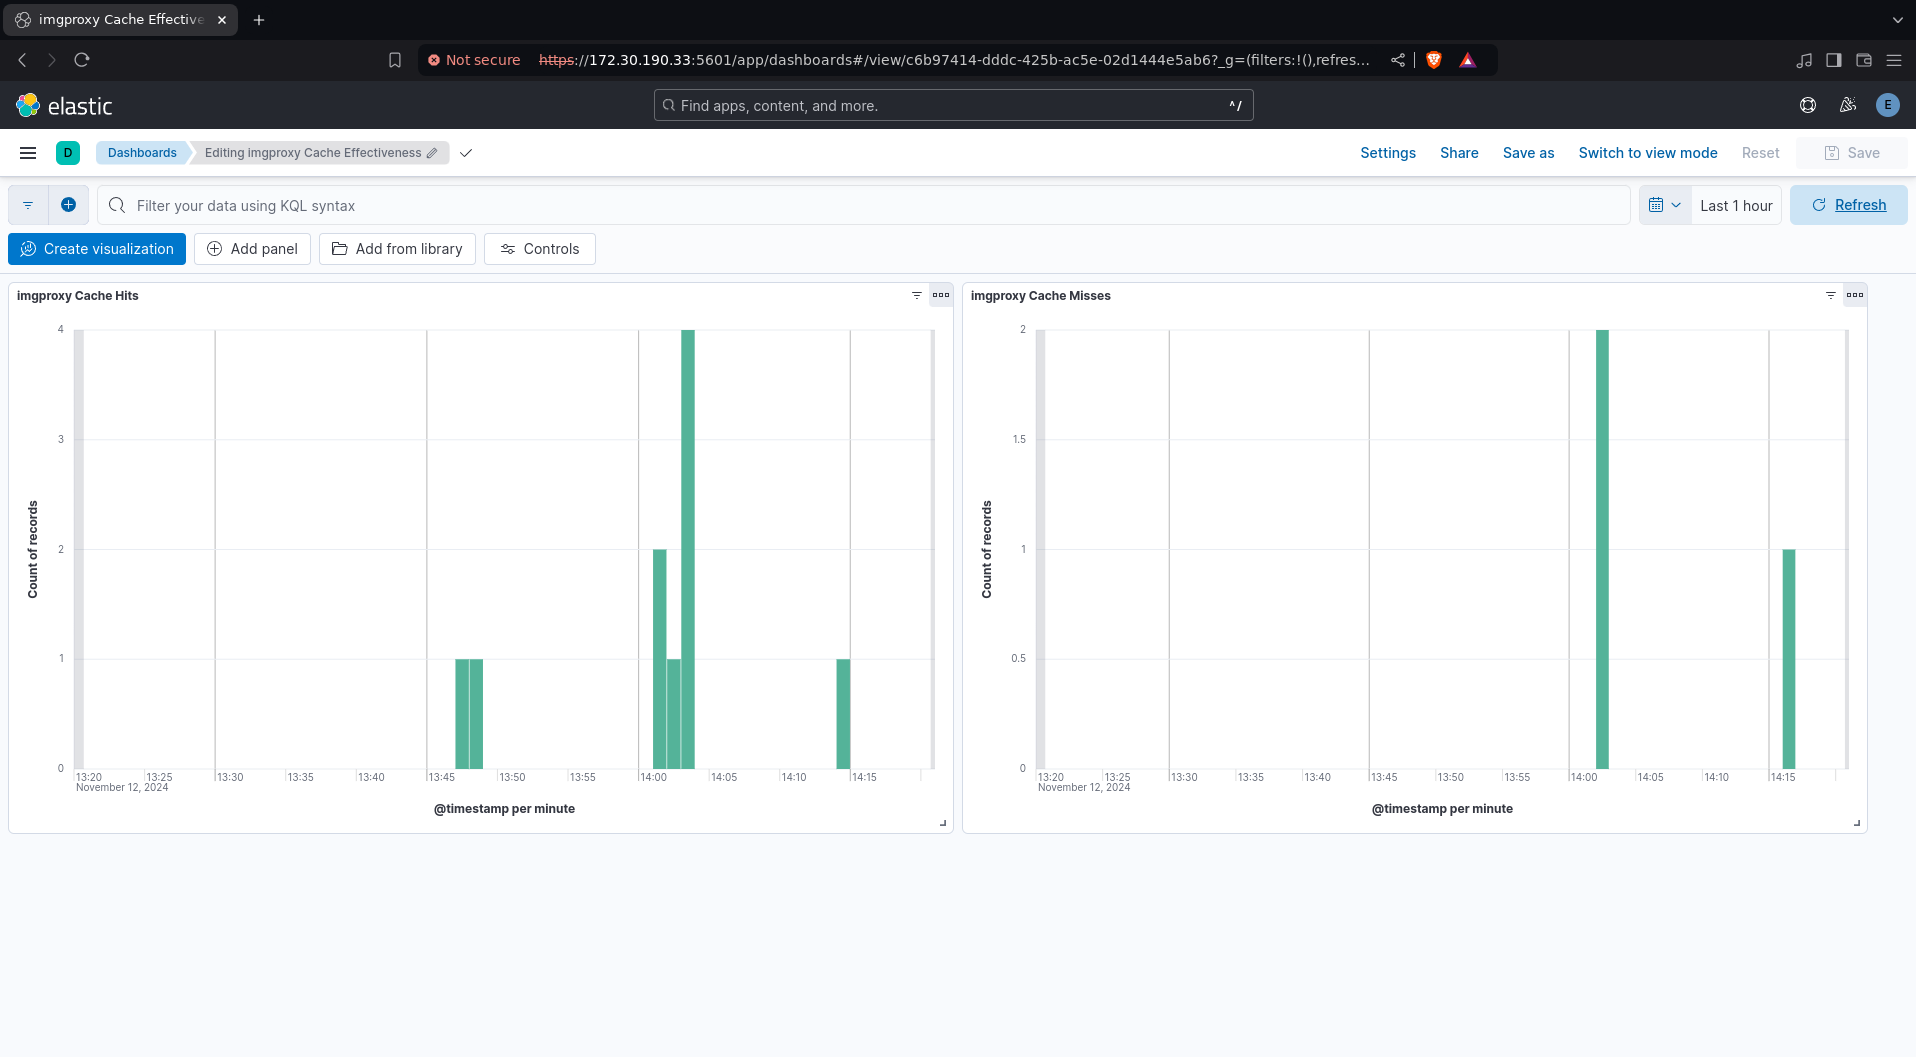
These are notes on feeding logs from my image cache running on kubernetes into elasticsearch ECK.
First off, I have the elastic stack installed via a combination of helm, opentofu, and argocd:
resource "helm_release" "eck" {
  name       = "eck"
  namespace  = "default"
  repository = "https://helm.elastic.co"
  chart      = "eck-operator"
  version    = "2.14.0"
}
---
apiVersion: elasticsearch.k8s.elastic.co/v1
kind: Elasticsearch
metadata:
  name: prod
  namespace: default
spec:
  version: 8.16.0
  nodeSets:
    - name: default
      count: 1
      config:
        node.store.allow_mmap: false
      volumeClaimTemplates:
        - metadata:
            name: elasticsearch-data
          spec:
            accessModes:
              - ReadWriteOnce
            resources:
              requests:
                storage: 16Gi
            storageClassName: ceph-block
---
apiVersion: kibana.k8s.elastic.co/v1
kind: Kibana
metadata:
  name: prod
  namespace: default
spec:
  version: 8.16.0
  count: 1
  elasticsearchRef:
    name: prod
    namespace: default
---
apiVersion: beat.k8s.elastic.co/v1beta1
kind: Beat
metadata:
  name: prod
  namespace: default
spec:
  type: filebeat
  version: 8.16.0
  elasticsearchRef:
    name: prod
    namespace: default
  config:
    filebeat.inputs:
      - type: container
        paths:
          - /var/log/containers/*.log
  daemonSet:
    podTemplate:
      spec:
        dnsPolicy: ClusterFirstWithHostNet
        hostNetwork: true
        securityContext:
          runAsUser: 0
        containers:
          - name: filebeat
            volumeMounts:
              - name: varlogcontainers
                mountPath: /var/log/containers
              - name: varlogpods
                mountPath: /var/log/pods
        volumes:
          - name: varlogcontainers
            hostPath:
              path: /var/log/containers
          - name: varlogpods
            hostPath:
              path: /var/log/pods
To get pod logs into elasticsearch, im using filebeat. Hosts’ /var/log/containers directories get mounted into a daemonset of filebeat containers, which forward them to elasticsearch.
This lets us search logs across all containers in the cluster in kibana like so:
log.file.path: /var/log/containers/...
There may be a more straightforward way to do this with some k8s-native plugin for elasticsearch, but this is the approach outlined in the eck filebeats quickstart.
With elasticsearch in place, we can now craft some useful queries.
The imgproxy service writes simple ‘cache hit’ or ‘cache miss’ tokens to its logs:
imgproxy-lite-687dbb7dcb-tvsfj imgproxy-lite 10.42.0.33 - - [12/Nov/2024 20:01:31] "GET /?img=main.jpg&q=50 HTTP/1.1" 200 -
imgproxy-lite-687dbb7dcb-tvsfj imgproxy-lite cache hit
imgproxy-lite-687dbb7dcb-tvsfj imgproxy-lite 10.42.0.33 - - [12/Nov/2024 20:02:28] "GET /?img=main.jpg&q=50 HTTP/1.1" 200 -
imgproxy-lite-687dbb7dcb-tvsfj imgproxy-lite cache hit
imgproxy-lite-687dbb7dcb-tvsfj imgproxy-lite 10.42.0.33 - - [12/Nov/2024 20:02:37] "GET /?img=main.jpg&q=51 HTTP/1.1" 200 -
imgproxy-lite-687dbb7dcb-tvsfj imgproxy-lite cache miss
… which we can match in kibana:
log.file.path: /var/log/containers/imgproxy* and "cache hit"
Finally, we just need to create a dashboard in kibana with a “cache hit” query and a “cache miss” query:

