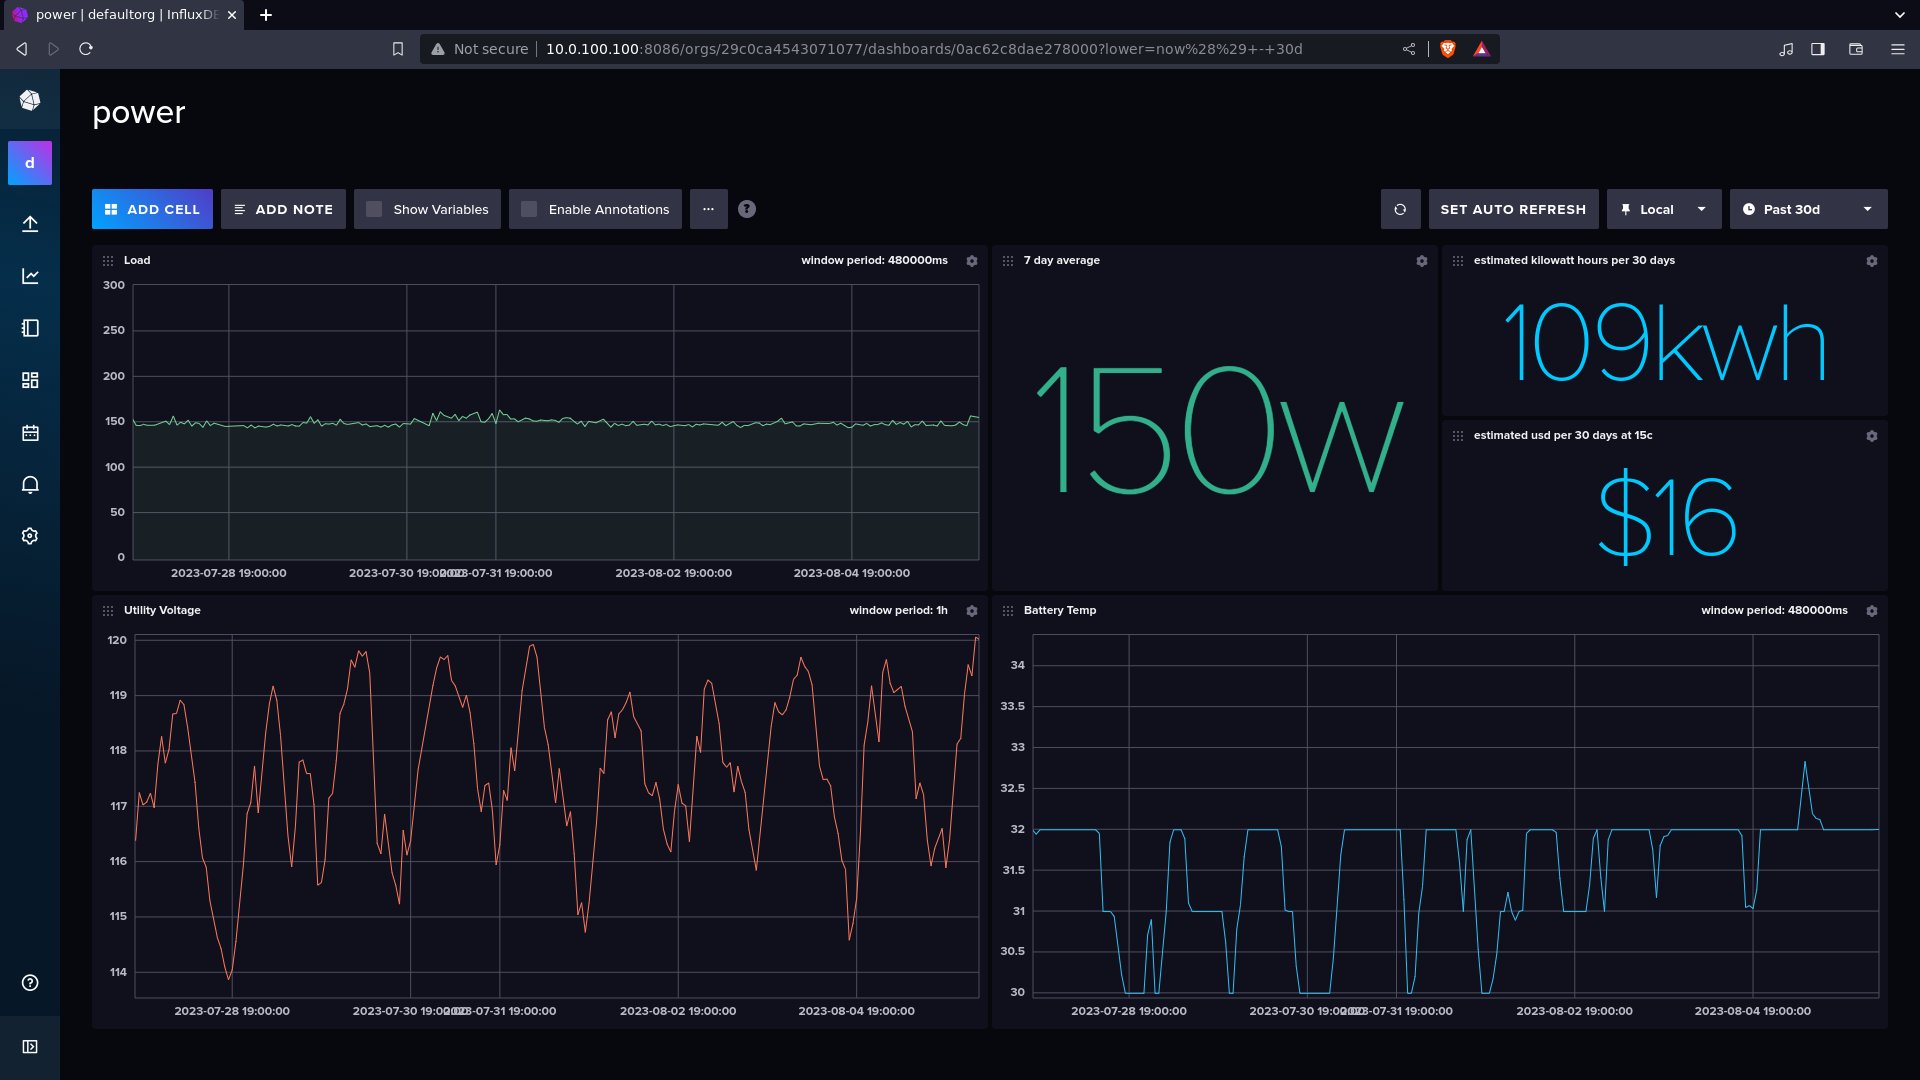
I have a ‘smart’ series Tripplite ups with a network card, but the web ui has long since lost modern browser support. Luckily the thing serves snmp, so I wrote some python/go to fetch metrics from the device and land them in InfluxDB running in kubernetes.

Heres the dashboard. Some may not know, influx has a grafana-like web ui built in these days - its not nearly as full featured, but its nice to have it all in one service.
Im pulling wattage, wall voltage, and battery temp, and doing some calculations to figure out kwh and monthly cost.
The utility voltage is interesting - it clearly reflects that load is low on the grid at the coolest part of the day (5-6am), and highest at the hottest hour (5-6pm). Some of this likely also corresponds with sleeping/working/tv-watching hours. It also reaches record lows on very hot days; I’ve seen as low as 113 volts when it was over 100F out.
an aside on monitoring at scale
I must say, working with snmp is torture. For something with ‘Simple’ in the name, it is horrendously overcomplicated - you either have to get a hold of a vendor-specific MIB (management information base), or eyeball the output of snmpwalk to get a device’s capabilities (OIDs). These are of course cyptic strings like .1.3.6.1.2.1.33.1.3.3.1.3.1, which is the (Tripplite) OID for AC input voltage (on this model?). While I’m willing to entertain the idea that SNMP is indeed well-reasoned and I’m just not doing it right - it seems we could achieve the same end result with a simple http server serving a self-describing json document with key pairs like {“watts”:100, “temperature”:35}. This doesn’t solve the issue of consistency from vendor to vendor, but mappings would at least be trivial for anyone to come up with by just looking at the json in a browser. We don’t need ‘communities’, multi-user support, ssh, email, ’traps’, we definitely dont want writable configuration (snmpv3) - I would argue we dont even need authentication or https for reading an integer from a PDU; throw it all on a vlan/vxlan and don’t route it anywhere. These ‘features’ are all liabilities. If I were tasked with collecting metrics from 100+ pdus/batteries/sensors in a datacenter, I would want:
- read-only, simple-as-possible json over http.
- read-only, simple-as-possible firmware. not configurable whatsoever.
- dhcp for addressing. devices get ips from dhcpd running on top-of-rack management access switches. discovery happens via scanning barcodes/recording mac addresses at installation, and probing arp/dhcpd leases.
- a daemon running somewhere in the datacenter looks at the hardware inventory, looks at the site-wide dhcpd database / discovery service, then polls devices and pushes data to an arbitrary time series database.
Maybe you’re running linux on your management switches, in which case it may be nice to have them do the discovery and reporting all in one daemon. This would scale nicely - the ‘monitoring’ broadcast domain wouldn’t have to leave the rack, and the same address space could be reused everywhere.
The unfortunate part of my setup is that the network card in the ups seems to be getting less reliable. I’ll occasionally find it in a state where I can ping its ip, but its not answering snmp queries. It sort of worries me having an ancient mystery device on the network, so I’m working on replacing it all with a current-clamp based arduino with an ethernet shield built into a 1u box with a simple straight-through AC input and ouput - a general-purpose power meter with trustworthy software that will work with any AC load.
